Geospatial Analysis: Accurate Risk Maps in 2025
Discover how geospatial analysis improves the accuracy of risk maps in 2025, enhancing decision-making and disaster preparedness with advanced mapping techniques.
CLIMATE RESILIENCE
Imran Jakhro
4/18/202514 min read
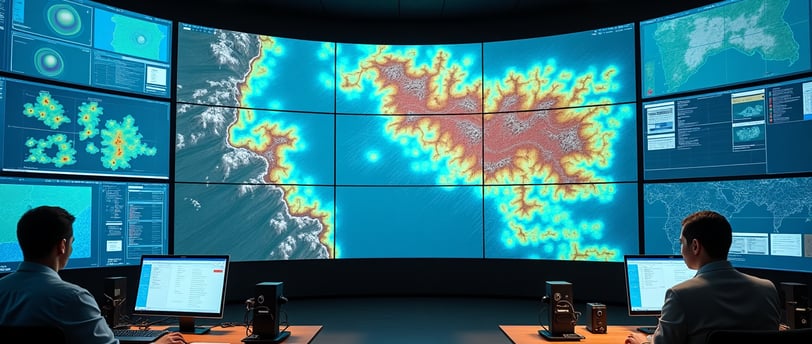
Remote sensing technology helps emergency teams respond up to 20% faster by analysing disaster-affected areas from above. This remarkable speed boost shows why rescue teams need geospatial data and tools to save lives and manage emergencies affordably.
Geographic Information Systems (GIS) combined with remote sensing gives teams a detailed view of terrain and environmental conditions during disasters. These tools help integrate data immediately, determine damage levels, and direct resources where needed. Different types of geospatial analysis tools - from raster-based systems to cloud platforms - are making risk maps more dependable and precise for disaster management in 2025.
Let's get into the newest advances in geospatial analysis platforms and assess the tools and techniques that create more accurate risk maps to reduce disaster risks better.
Types of Geospatial Analysis Used in Risk Mapping
Geospatial analysis techniques are now vital tools that create accurate risk maps to guide disaster management strategies. Each method brings unique capabilities to understand risk patterns across landscapes.
Raster-based analysis for flood and fire risk zones
Raster-based analysis represents continuous surfaces through grid cells, which makes it perfect to model environmental events. To assess wildfire risk, this method combines several factors like slope, land cover, distance to roads, aspect, and visibility from fire lookout towers. Fire spreads faster uphill on steeper slopes, making them harder to control. The south-facing slopes get more direct sunlight, which leads to drier vegetation and higher fire risk.
For flood risk assessment, raster analysis looks at elevation, rainfall patterns, soil types, and watershed features. This method spots flood-prone areas by analysing the topographic wetness index (TWI), which tells us about surface saturation and soil moisture. Research shows that areas with gentle slopes near water bodies face higher flood risks. High-elevation regions with heavy rainfall often see less direct effects.
ROC analysis can confirm the accuracy of raster-based flood risk maps, with some studies reaching reliability values of 0.92. Wildfire vulnerability assessments that use weighted overlay techniques have reached precision coefficients (AUC) of 0.778, which proves these methods work well.
Vector overlay techniques for vulnerability mapping
Vector overlay analysis combines multiple spatial datasets to spot high-risk areas. This method works great for making complex decisions in risk mapping. The analytical hierarchy process (AHP) are the foundations of these assessments, which lets researchers weigh different risk factors based on importance.
A detailed study used physical, socioeconomic, and coping capacity factors to assess flood vulnerability through weighted overlay techniques. Results showed that 25% of the study area faced high to very high risk due to nearby waterways, heavy rainfall, and social factors. Adding coping capacity metrics like flood shelters and health facilities changed the vulnerability assessment substantially, which shows why this often-missed aspect matters so much.
Vector overlay analysis works best with these key steps:
Standardisation of various datasets into common scales
Classification of values into vulnerability categories (very low to very high)
Weighting of criteria through analytical methods like AHP
Integration of weighted layers to produce detailed vulnerability maps
Network analysis for evacuation route planning
Network analysis finds the best evacuation routes during disasters, which helps save lives through quick emergency movement. This technique uses road network data to find the fastest and safest paths to secure locations.
Research shows that good evacuation modelling uses two main approaches: closest facility analysis and service area analysis. These methods not only find the best routes but also tell us how long evacuation might take. One project used network analysis to identify 50 different fastest routes with evacuation times between 30-45 minutes.
Network analysis faces some real challenges. One study noted that "obtaining the proper road network dataset along with its type and width was not possible," which forced the team to use OpenStreetMap data without road width details. This shows why we need better infrastructure data to plan evacuations.
Temporal analysis for climate-related hazard trends
Temporal analysis tracks how hazards change over time, which helps us understand climate-related risks better. This method uses time-series data to spot changes in temperature, rainfall patterns, and how often extreme events happen.
Climate extreme studies have found clear trends. The Mann-Kendal test results showed more winter rain and cooler summers in the Karakoram region from 1962-1990. Later decades (1991-2019) saw less rain and higher temperatures (2010-2019), which matches recent glacier mass loss observations.
Temperature extreme analysis reveals more summer days (SU25) in most regions, while cold days (TX10p) decreased across the country with few exceptions. Consecutive dry days (CDD) increased from 1991-2019 in most areas. These patterns help predict future climate scenarios so communities can prepare for new hazard patterns.
These different geospatial analysis techniques give us complementary insights to develop detailed risk maps. Together, they help us spot hazard zones, understand vulnerability factors, plan evacuations, and track changes over time—all crucial elements for better disaster risk reduction in 2025.
Tools for Geospatial Analysis That Improve Map Accuracy
Picking the right geospatial analysis tools plays a vital role in creating accurate risk maps that help reduce disaster risks. Field practitioners have found that the right software can make hazard predictions much more precise and reliable across many disaster scenarios.
QGIS vs ArcGIS Pro: Feature comparison for DRR
The decision between open-source and proprietary platforms can make a big difference in risk mapping, especially with limited resources. QGIS provides a cost-effective solution that smaller organisations and projects with tight budgets find helpful. Its plugin system and active community support drive new innovations that prove valuable for disaster risk reduction.
In stark comparison to this, ArcGIS Pro offers powerful analytical capabilities that complex, large-scale risk assessment studies need. The sophisticated spatial analysis tools and complete documentation make it worth the higher cost for major institutions working on detailed disaster risk mapping. ArcGIS shines when it comes to performance and 3D visualisation, which makes it especially good at modelling complex terrain-related hazards.
When it comes to disaster risk reduction, ArcGIS has advanced tools that let users analyse risk sources, spot vulnerable populations, predict what might happen, and support smart investment policies. All the same, QGIS works exceptionally well for disease mapping and accessibility analysis in humanitarian situations where customization and cost matter most.
Google Earth Engine for real-time satellite data processing
Google Earth Engine marks a breakthrough in geospatial analysis by combining a multi-petabyte catalogue of satellite imagery with massive processing power. The platform contains over 80 petabytes of geospatial data ready for instant analysis, including more than thirty years of historical imagery that gets updated daily. This big dataset lets analysts track disaster-related changes over time like never before.
Earth Engine's practical applications in disaster management include:
Global Forest Watch uses near real-time forest monitoring to help users blend decade-long data or get alerts about possible new threats as they emerge
The European Commission's Joint Research Centre developed high-resolution maps showing global surface water patterns, changes, and transitions
Supply chain managers can analyse land cover at sourcing sites to spot deforestation risks
The platform's cloud architecture overcomes old computing limits that used to hold back large-scale geospatial analysis. On top of that, it offers an Earth Engine API in both Python and JavaScript, so practitioners can build custom algorithms with instant access to massive datasets. Disaster risk reduction specialists can now process satellite imagery at scale without buying expensive local computing equipment.
GRASS GIS for terrain and hydrological modelling
GRASS GIS excels with its reliable analytical capabilities designed for complex geospatial tasks involving water and terrain. This makes it particularly useful for flood risk assessment and hydrological modelling that disaster preparation requires.
GRASS GIS offers several specialised hydrological tools that make risk maps more accurate:
The r.watershed tool creates watershed basin analysis, while r.water.outlet generates watershed basins from drainage direction maps. The r.lake tool fills lakes to target water levels from given starting points—a key feature for flood scenario modelling. The r.hazard.flood tool quickly finds flood-prone areas, which helps a lot in basins with marked topography.
For advanced needs, GRASS includes r.damflood, a built-in hydrodynamic 2D model that shows how flooding might spread after dam failures. This special tool solves shallow water equations with finite volume methods and creates various output maps showing maximum water depth, velocity, and flooding intensity.
Users can run simple flood risk assessments by setting computational regions for study areas and using raster calculators to model different flooding scenarios. GRASS GIS blends powerful analytical features with practical usability that organisations focused on water-related disaster risk reduction need.
The choice of geospatial analysis tools depends on project needs, available resources, and technical expertise. Each platform helps improve risk map accuracy for disaster management in its own way.
Materials and Methods: Building a Risk Map with Geospatial Data
Building accurate risk maps needs a well-laid-out method that turns raw geospatial data into applicable information. A step-by-step workflow will give a reliable and precise output for disaster scenarios of all types.
Data acquisition from satellite, drone, and field sources
Reliable data collection forms the foundation of any risk map. Getting data from multiple sources creates complete input layers that show different aspects of potential hazards. Satellite imagery gives extensive coverage of hard-to-reach areas with continuous, human-independent measurements. Research teams often use SRTM digital elevation models with 30m resolution from USGS. These models help calculate topographic wetness index (TWI), elevation, slope, and drainage networks.
Teams collect field-based data through ground control points (GCPs) with GNSS receivers that use real-time kinematic techniques. These points substantially improve geometric accuracy when processing aerial images. Research teams usually place 6-9 GCPs throughout study areas to get enough positional accuracy.
Unmanned aerial vehicles (UAVs) bridge the gap between satellite and ground observations. Flight plans usually follow strips along monitored areas. The recommended forward overlap is 80% and side overlap should be more than 50% to cover wider areas. Images should have nadiral orientation and contain some land features to help with matching later.
Pre-processing and georeferencing workflows
Raw data needs systematic processing before it fits into risk models. Standard preprocessing has several key steps: data selection, calibration, atmospheric correction, orthorectification, and export.
Radiometric calibration changes raw digital numbers into meaningful units like radiance or reflectance for satellite imagery. Methods ranging from simple dark object subtraction to complex Fast Line-of-sight Atmospheric Analysis of Spectral Hypercubes (FLAASH) remove atmospheric disturbances that change spectral signatures.
Orthorectification fixes geometric distortions caused by sensor angle, Earth curvature, and terrain variations. This step uses rational polynomial coefficients (RPC) sensor models or replacement sensor models (RSM) with digital elevation data. Spatial accuracy remains crucial as errors affect later analyses.
UAV image processing follows its own path: image preprocessing, feature extraction and matching, self-calibration and bundle adjustment, dense image matching, and quality control. Software like GRAPHOS or NodeGraphos within OpenDroneMap makes these tasks easier.
Layer integration and spatial interpolation techniques
Layer integration plays a vital role in developing risk maps. Spatial interpolation methods fill gaps between sampled locations to create continuous surfaces needed for thorough analysis. Kriging stands out as an advanced geostatistical approach that looks at spatial autocorrelation between observations.
Parameter selection affects results more than the choice of method itself. Cross-validation serves as the standard way to check prediction accuracy. This usually involves mean error and root mean square error metrics.
The analytical hierarchy process (AHP) helps integrate multiple risk factors systematically. Experts select influencing factors and assign relative scores through pairwise comparisons using Saaty's 1–9 weighing scale. They also evaluate matrix consistency. This method lets experts compare factors like TWI, elevation, and precipitation to create normalised principal eigenvectors that guide the final risk assessment.
Weighted overlay analysis combines all reclassified raster layers based on their importance. GIS platforms perform this operation to create complete risk maps that show how all factors work together.
Results and Discussion: Accuracy Metrics in Risk Mapping
Accuracy metrics are the life-blood of risk mapping that help practitioners measure reliability and boost decision-making in disaster management. These metrics measure precision in various dimensions and end up determining if risk maps can be trusted to save lives.
Root Mean Square Error (RMSE) in hazard prediction layers
Root Mean Square Error stands out as one of the most accessible measures to evaluate prediction quality in geospatial risk mapping. RMSE calculates the square root of the mean of squared differences between predicted and observed values. This calculation penalises larger errors more than smaller ones. This feature makes RMSE valuable in disaster contexts where outlier events cause devastating impacts.
RMSE offers several advantages over alternatives like Mean Absolute Error (MAE):
Compatible with common statistical assumptions when error distributions follow Gaussian patterns
More discriminating in identifying model performance differences by giving higher weight to unfavourable conditions
Avoids the use of absolute values, making it mathematically preferable for gradient calculations and sensitivity analysis
RMSE values closer to zero show better model performance in hazard prediction layers. Studies show that with enough samples (n≥100), RMSE can effectively reconstruct the underlying error distribution. This provides a great way to get insights in flood risk mapping, where precise predictions of inundation depths directly shape evacuation planning and infrastructure protection.
Validation using historical disaster footprints
Historical disaster data serves as the gold standard for risk map validation and provides solid evidence of a model's predictive capabilities. Practitioners overlay historical disaster points with predicted risk zones to calculate overall accuracy percentages in field applications. Flood risk maps have achieved 83% accuracy when verified against 134 historical flood points. These points came from field observations, resident interviews, and water tail evaluation.
A complete validation needs historical records from many sources. National databases like EM-DAT fall short for smaller-scale events. Local fieldwork, archival research, and interviews fill these gaps. Researchers in Saint Vincent compiled information on 81 discrete hazard events between 1901-2000. They used books, journal articles, local newspapers, and reports from organisations like the Caribbean Development Bank.
Time plays a crucial role, as shown by disaster databases that track events year-round. Analysis of these events' spatial distribution reveals patterns across regions. This historical data combined with damage assessments creates a reliable framework to determine if risk maps accurately predict both location and impact severity.
Overlay accuracy in multi-hazard risk zones
Multi-hazard risk mapping faces unique accuracy challenges due to integrating multiple hazard layers with different characteristics. ISO 19157 defines positional accuracy as a key quality element. Mean value of positional uncertainties and root mean square error measure this accuracy. These measures determine if overlaid hazards have enough spatial precision for reliable composite analysis.
Overlay techniques must consider both hazard occurrence probability and spatial representation uncertainty. One approach creates hexagonal minimum cartographic units. Multi-hazard levels in each cell measure spatial overlays and interactions among possible hazards. This method accepts inherent uncertainty while providing useful information.
The validation of multi-hazard risk models gets nowhere near the attention of single hazard models. Experts note that "validation is perhaps the least practised activity in current flood risk research". This gap shows we need standardised approaches to multi-hazard validation. Better observational data collection and documentation of past events across multiple hazard types will help achieve this goal.
Limitations in Geospatial Risk Mapping Accuracy
Risk maps still face major challenges despite recent progress in geospatial analysis techniques. Disaster risk reduction experts need to understand these limitations to properly use and interpret geospatial findings.
Resolution mismatch between datasets
Combining geospatial data from multiple sources creates accuracy problems due to scale differences. Research shows that relationships between different data sources and population change at various levels. This can lead to big prediction errors when combining datasets of different resolutions. The problem becomes clear in cross-resolution mapping where mismatched resolutions between source datasets create unreliable labels.
A cell's accuracy depends heavily on its size and how much the area varies spatially. This creates problems when experts try to convert regional data into detailed grid-level analysis. Studies show that smaller differences in scale between training and prediction samples create more reliable results with similar distribution patterns.
Temporal gaps in satellite imagery
Clouds pose the biggest obstacle to satellite-based risk assessment. Cloud cover has delayed finding severely affected remote areas for more than a week after disasters like the 2015 Nepal earthquake. These delays increase overall disaster risk because rescue time directly affects death rates.
Optical sensors face the most challenges. Clouds, haze, and smoke block parts of images and distort the results. Active sensors can help solve this problem, but they come with their own limits related to pixel size and time between passes.
Different platforms have varying revisit times. Some sensors like MODIS take daily pictures, while others like QuickBird and IKONOS need more time between passes. Time becomes crucial when disasters happen quickly and peak conditions last only hours.
Lack of ground-truth data in remote areas
Getting reliable ground validation data remains difficult, especially in remote areas. Traditional field surveys cost too much money and time to use in large areas. Historical ground data is either very hard to find or doesn't exist in many places.
The data that experts call "ground truth" often contains its own errors because it comes from indirect sources. Google Earth and high-resolution imagery interpretations have proven surprisingly inaccurate when compared to actual ground measurements. This creates a serious problem because the standards used to verify risk maps might be wrong themselves.
Evaluating Geospatial Analysis Platforms for DRR Use Cases
The choice of a geospatial platform can make a huge difference in how well disaster risks are reduced, especially where resources are limited. Technical specifications and practical deployment aspects both play vital roles when evaluating these platforms for disaster management.
Open-source vs proprietary software in low-resource settings
Organisations in disaster-prone regions with tight budgets face important trade-offs when choosing between open-source and proprietary geospatial software. Open-source GIS saves money by cutting out licencing fees that eat up large chunks of disaster management budgets. Many organisations spend money on software licences with features they don't really need - it's like buying a Ferrari when a Fiat would do the job.
The money saved on open-source platforms can go toward custom technical support and training instead of endless licencing fees. This works really well in developing countries where long-term disaster risk reduction projects often fail due to sustainability issues.
Proprietary solutions still shine in certain situations. Studies show these platforms usually have better documentation and dedicated support teams - key factors during emergencies. Many organisations think proprietary software works better for critical tasks, even though open-source options might actually be safer thanks to their open code review process.
Cloud-based geospatial analysis platforms for scalability
Cloud computing has completely changed how we handle geospatial analysis in disaster management by letting us process huge datasets across different locations. These platforms flex their computing muscle based on need, without requiring expensive local infrastructure. Organisations only pay for what they use - perfect for disaster work where processing needs swing wildly between planning and response phases.
Quick analysis can mean the difference between life and death in disasters, and cloud platforms deliver resources right when needed. Google Earth Engine shows what's possible with over 80 petabytes of geospatial data that can track forest changes and map surface water almost instantly.
Interoperability with national SDI frameworks
Modern disaster risk reduction relies heavily on national Spatial Data Infrastructure (SDI) frameworks that help organisations share data. The Open Geospatial Consortium's standards - WMS, WFS, and WPS - create common ground rules for accessing and working with spatial data through standard protocols.
Different countries have taken different approaches to these frameworks. Countries with more open policies usually have advanced SDI systems and share data freely, while developing nations struggle with limited resources and coordination. Pakistan knows SDI matters but faces real challenges like weak partnerships and not enough technical infrastructure, which makes coordinated disaster response harder.
The best platform choice depends on both technical capabilities and real-world factors like money, people's skills, and existing infrastructure.
Last Words
Geospatial analysis is the life-blood of modern disaster risk reduction. It has revolutionised our methods to predict, prepare for, and respond to natural hazards. Risk maps now deliver exceptional accuracy and reliability thanks to advanced techniques like raster-based analysis, vector overlay, and network analysis.
My years in the field have taught me that these technologies work best when adapted to local contexts and resources. ArcGIS Pro packs powerful features, but organisations with tight budgets often find open-source alternatives more affordable. Google Earth Engine's cloud-based processing excels at handling massive datasets, especially when you have real-time disaster monitoring needs.
Today's geospatial analysis don't deal very well with resolution mismatches and gaps in satellite imagery timing. Yet technological progress steadily overcomes these hurdles. Organisations should assess their specific needs, resource availability, and how they'll integrate with national SDI frameworks before picking their platforms and tools.
Do you need help implementing these geospatial analysis techniques for disaster risk reduction? Reach out at contact@imranahmed.tech or visit www.imranahmed.tech for detailed consultations.
Geospatial analysis will keep driving the creation of more accurate risk maps that protect communities and save lives. The path to success combines choosing the right tools with building eco-friendly, locally-adapted solutions that truly help vulnerable populations.
For more insights on climate resilience, check out my article on Climate-Proof Livelihoods in the Global South.
Learn how anticipatory action is reshaping disaster preparedness in my post on Anticipatory Action or Aid.
Explore the importance of advocacy in building climate resilience in my article Advocacy for Climate Resilience.
References
[1] OSGeo. (n.d.). Hydrological Sciences. GrassWiki. Retrieved from https://grasswiki.osgeo.org/wiki/Hydrological_Sciences
[2] IntechOpen. (2021). Advances in Hydrological Risk Management. Retrieved from https://www.intechopen.com/chapters/1192070
[3] MDPI. (2020). Geospatial Data for Disaster Risk Assessment. MDPI Journal, 6(5), 123. Retrieved from https://www.mdpi.com/2504-446X/6/5/123
[4] Springer. (2024). Geospatial Approaches for Hazard Mapping. Environmental Monitoring and Assessment. Retrieved from https://link.springer.com/article/10.1007/s13201-024-02293-1
[5] Springer. (2025). Remote Sensing for Risk Management. Environmental Science and Technology. Retrieved from https://link.springer.com/article/10.1007/s44288-025-00108-7
[6] Springer. (2020). Geospatial Analysis for Disaster Risk Reduction. Natural Hazards. Retrieved from https://link.springer.com/article/10.1007/s11069-020-04387-w
[7] CDEMA. (n.d.). Hazard Assessment and Data Analysis. Retrieved from https://www.cdema.org/virtuallibrary/index.php/charim-hbook/use-case-book/8-hazard-assessment/8-1-analysing-historical-data-of-hazard-events
[8] MDPI. (2021). Remote Sensing and GIS in Disaster Risk Management. MDPI Journal, 13(9), 328. Retrieved from https://www.mdpi.com/2220-9964/13/9/328
[9] In-Depth Research. (2022). Mastering GIS Software: A Guide to ArcGIS and QGIS. Retrieved from https://indepthresearch.org/blog/mastering-gis-software-proficiency-a-guide-to-arcgis-and-qgis/
[10] OGC. (n.d.). OGC Standards for Geospatial Data. Retrieved from https://portal.ogc.org/files/?artifact_id=6196
Impact
Pioneering resilience through global development practices.
Contact
Reach
contact@imranahmed.tech
+92 333 3283340
© 2025. All rights reserved.
Legal
imranahmedjakhro1@gmail.com